Neutral
to Weak El Nino Conditions In Effect
Slight Warming Pattern Taking Hold
Note:
We apologize for the long time between updates to this section
of the site. There really hasn't been much occurring with regards
to ENSO until now so we've focused on coding new
content.
Signs
of a weak El Nino are present, with momentum trying to build
in that direction but not there yet. The trend last fall/winter
(2005/2006) was neutral with tendencies towards La Nina, but
that was an anomaly looking over the longer arch of the past
few years which were characterized by the persistence of subtle
El Nino-like symptoms slowly but steadily taking
their toll on the atmosphere and building momentum. This
pattern started during the winter of 2002/2003 and again in the
winter of 2003/2004 with a generally neutral trend in.cgiace
punctuated by occasional signals of a developing El
Nino. The trend continued through 2004 with the strength
and frequency of the El Nino-like periods increasing, enough
to pass over the threshold to be considered a minimal but official
El Nino by late August. In early 2005, things started
to settle back down, but with exception as a major
eruption of the Madden Julian Oscillation (MJO) occurred
the first week of February, spawning a 40 day run of a very
negative Southern Oscillation Index, the strongest for that
time of year since the big El Nino of 97/98. A significant
increase in Northern Hemisphere storm activity ensued producing
a string of significant class swells and producing a strong
eastward moving Kelvin Wave. The MJO and SOI settled back down
only to again erupt mid-April 2005 with another negative
run of the SOI supported by a renewed active phase of the MJO,
and the Northern Hemisphere storm track tried to respond. But
by June and again in September 2005 two runs of strongly positive
Southern Oscillation Index values were experienced that pretty
much squashed any hope for a developing El Nino, with a weak
La Nina pattern setting up and holding through the winter
into the spring of 2006. That trend changed in May
with signs of El Nino starting to materialize again.
First
we look at the Southern Oscillation Index (SOI). This number
compares surface pressure over Darwin Australia with pressure
over Tahiti. If this value is negative that indicates
average surface pressure is lower over Tahiti and higher over
Darwin symptomatic of El Nino (wind flows from high pressure
towards lower pressure). When it's positive, the reverse it true
with higher pressure over Tahiti and lower pressure over Darwin,
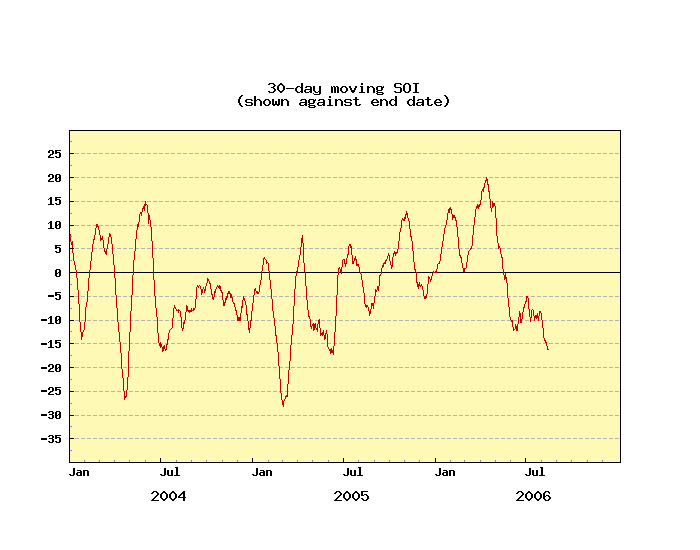
typical of La Nina. The first 5 months of 2006 recorded a
string of nearly consistent daily positive values. But starting
May negative values creeped into the record with occasional
8-10 day runs of reasonably deep negative values (-20 or so).
By late June almost all the daily values were negative and have
continued that way to present. A rather deep spurt was noticed
early August with daily values down to the -50 to -60 range.
The 30 day running average
right now is -15, neither extraordinarily low but certainly
not high, likely on the border of what would be considered mild
El Nino. Occasional downward bursts in the SOI are attributable
to the active phase of the Madden Julian Oscillation, which
can be traced to periods of enhanced storm activity in regions
where the MJO passes as well as fueling the eventual development
of full blown El Nino events (more details below).
Looking
at current seasonally adjusted equatorial Pacific Sea Surface
Temperatures (SST), the affects of the past few months of negative
SOI values are apparent. Consistently cooler than average water
temperatures cover the Western Pacific where normally warm water
resides. A steady stream of water about 0.5° warmer than
normal stretches from the west to the east over the equator with
tiny pockets up to 1.0° above normal. These waters have migrated
east over the equator, and are now pooled up off Ecuador,
Central America, and up the Mexican coast into Central California
and south into Peru. These waters are
not exceptionally warm as one would see during a real El Nino,
but the signature pattern is unmistakable. The South Pacific
is near normal, but up north a rather warm patch is sitting south
of the Aleutian Islands near the dateline, but is unrelated
to ENSO. Latent heat energy remains present over the entirety
of the North Atlantic as it has for several years, but not as
strong over the Cape Verde storm corridor (from West Africa due
west into the Caribbean Sea), perhaps signaling unfavorable
changes in surface winds and a weaker than forecast tropical
storm season there.
Wind
anomaly analysis indicates that near normal winds have been
occurring over the entire length of the equator, blowing
east to west, with occasional weak to moderate bursts of reversed
trades in the far Western Pacific (west of the dateline). But
none of these have been strong enough or long enough in duration
to qualify as a certified Westerly Wind Bust (WWB), a hallmark
of the active phase of the MJO and a precursor to El Nino. Most
are associated with the temporary passage of tropical storms
pushing towards the Orient. Still the fact that warm waters are
accumulating off Columbia and Peru suggest a weaker
than normal offshore gradient normally present off Northern
Peru. Historically if either El Nino or a strong burst of the
Madden-Julian Oscillation was in effect, winds would be averaging
from west to east. That is, when the MJO is in an active phase,
the trades reverse themselves in the West Pacific, and when the
MJO is not active, trades return. During La Nina, trades blow
much stronger than normal. Since the trades are not stronger
than normal nor have they reversed direction for any length of
time, the wind pattern is near neutral. But the warmer than
normal waters occurring in the East Pacific remain an indicator
of a developing pattern towards El Nino.
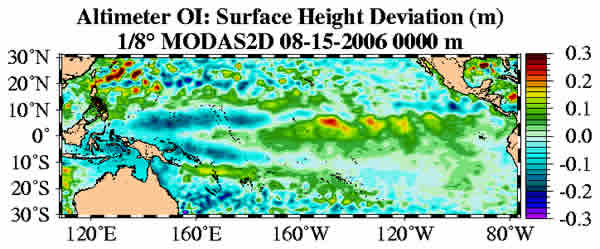
Another
indicator of El Nino or La Nina is a change in sea surface height.
Sea surface height is the height of the oceans surface relative
to 'average'. Satellite analysis indicates a moderate pocket
of 'above' normal height running along the equator
from 180W to the Galapagos Islands but not touching the South/Central
American coast, at 5-8 cm above normal, roughly paralleling the
wind anomalies and positive sea temperatures occurring in the
same area. This is not remarkable, but it is a far cry from being
negative or indicative of La Nina or to the 'below'
normal conditions that were experienced during the fall/winter
of 2005/2006.
Another
key indicator in the evolution of either an El Nino or La Nina
event is the depth and profile of the 20 degree isotherm (thermocline).
During La Nina events, warm subsurface water remains pooled
up in the far West Pacific near the equator. Cold surface and
subsurface waters dominate the East Pacific, resulting in a steep
angle from east to west, going from shallow in the east to deep
in the west. In El Nino events, as warm subsurface water (i.e.
Kelvin waves) migrate towards the eastern Pacific, the angle
flattens and becomes more consistent across the equatorial Pacific.
Latest data suggests that a moderate pocket of warm water is
transposed to the East, pulled away from the tropical West Pacific
and currently sitting under the equator between the dateline
and the Galapagos Islands, much as is indicated by the satellite
reports above. Theses waters have not reached the Central America
Coast and are not expected to unless some forcing event occurs
to provide momentum pushing them east. A significant 'shelf'
is noticeable at about 120W where the eastern edge of these waters
stop with a steep thermocline angle present
there into the Central America coast. This is
consistent with the push towards El Nino, but we're not there
yet. Much warmer waters need to be reaching the Americas first.
The
forcing event required would be a series of Kelvin Waves.
A Kelvin Wave is a pocket of warm water that travels under the
oceans surface from west to east at a depth of about 150-200
meters. It is generated by a burst of strong westerly winds blowing
over the equator (a.k.a. Westerly Wind Burst (WWB) in the West
Pacific associated with the MJO. As the warm surface water gains
eastward momentum, it sinks and travels well under the oceans
surface, only to reappear at the surface when it impacts the
South America Coast. This results in the sudden appearance of
warm waters along the coast of Peru and Ecuador. Occasional eruptions
are normal. Large and consistent eruptions are the hallmark of
solid El Nino events. The source of Kelvin Waves, a negative
SOI and reversed trades is directly related to the strength and
frequency of the Madden Julian Oscillation (MJO). This weather
pattern is responsible for the periodic strengthening of the
anomalous westerly winds in the West Pacific which drive production
of subsurface Kelvin waves, and also drive the SOI negative.
When the MJO enters an active phase, El Nino indicators strengthen,
and as it fades, so does El Nino. Currently
there is no indication of any solid Kelvin Wave activity, but
a consistent channel of water 1° warmer than normal subsurface
waters is present extending from the dateline to 120W (near the
Galapagos Islands) with 2 imbedded pockets up to 2° above
normal. There have been occasional short spurts of westerly winds
over the West Pacific, and it is assumed these mini-Kelvin waves
originate from them. But they are not particularly impressive,
and fall into the statistically normal range for such activity.
Reviewing
all the data, there emerges a picture consistent with a neutral
pattern pushing towards mild El Nino, but no 'smoking gun' or
forcing event appears imminent to push it over the edge. The
SOI is negative in bursts, but not markedly and consistently
so, with warmer water pushing to the Mid-Pacific but not making
rapid progress. There is no significant or consistent
Kelvin Wave activity and nothing appears imminent to start that
machine in motion. So these occasional signals of El Nino fall
within the statistical boundaries consistent with normal conditions.
This suggests neutral conditions biased slightly towards El
Nino should continue through the Fall/Winter of 2006/2007. Historically
if some major change towards El Nino were to occur in the coming
months, significant evidence leading up to it's peak would already
be accumulating, which it is not.
Always
of interest and a good leading indicator is the relative activity
level of the Atlantic hurricane season. This past few years activity
has been record breaking.
For 2006 Dr. William Gray and the team at the University of Colorado
have again predicted an active season, but with the latest update
(8/3/06) have revised their forecast downward slightly to 15
storm and 7 hurricanes, 3 of which are to be intense. Given the
current state of the Tropical Pacific biased towards weak El
Nino, the relative cooling of tropical Atlantic waters, the
relative lack of anything occurring in the Atlantic and what
has formed is on the periphery of the Cape Verde Storm Corridor,
and being less than a month away from the historical peak of
activity, we suspect their forecast still might be on the high
side.
The
latest El Nino discussion from the Climate Prediction Center/NCEP
(August 10, 2006) suggests that ENSO-neutral conditions to continue
over the next 1-3 months with a 50% chance of weak El Nino conditions
by year end. This seems reasonable given the current state of
the environment.
Of
12 ENSO models run in Aug 2006, 10 indicate neutral conditions
by year end and 2 suggest mild El Nino.
LONG-RANGE NORTH PACIFIC STORM AND SWELL GENERATION POTENTIAL FORECAST
Fall/Winter
2006-2007 Swell Generation Potential (for California & Hawaii)
= 6.0
There
is no data supporting development of either a significant El Nino
event or degradation into a La Nina event over the next 6 months.
But a steady state seems likely with a slight bias towards El
Nino but not growing in the direction strongly. El Nino typically
enhances the size, strength and frequency of winter North Pacific
storms in and around the Gulf of Alaska, thereby improving the
likelihood for large winter surf in California and Hawaii. Current
data suggests little if any enhancing effect expected.
So
for now,.cgian on 'normal' Pacific Fall/Winter periods of
enhanced storm cycles supported by the active phase of the Madden
Julian Oscillation followed by periods of relative inactivity.
(This forecast is highly speculative and based on historical analysis of past La Nina/El Nino events and the latest long-range forecast models)
Sea Surface Temperature Anomalies
Courtesy: NOAA NESDIS
Notice a broad area of warmer than normal water (orange/red) tucked along Central America, Mexico up into California and southward to Peru. These waters also sit over the equator tracking from the dateline eastward into the East Pacific, typical of weak El Nino conditions. This is created by surface winds blowing west to east over the equator,reverse of the normal trade wind flow there.
.
Sea Surface Temperature Anomalies and Average Surface Winds on the Equatorial Pacific
Courtesy: NOAA PMEL
In the top image notice winds blowing from east to west over the entire Tropical Pacific Ocean, the standard trade wind pattern for this time of year. One exception, the wind is blowing west to east in the far West Pacific, a hallmark of a Westerly Wind Burst and a precursor to El Nino. Notice in the lower image that slightly anomalously warmer waters are tracking from the West Pacific towards South America caused by these same winds that were blowing tot he east over the West Pacific over the past several months. As a result water temperatures are 0.5-1.0 degree C above normal.
.
Sea Surface Height Deviation
Courtesy: NLOM
Consistent with the image above, notice that sea surface heights are slightly above normal right over the equator east of the dateline pushing towards South Americas. Warmer waters raise the oceans surface slightly.
.
20 Degree Thermocline Depth and Position Time Series
Courtesy: CPC NCEP NOAA
(Top Image) The core of warm subsurface water is centered slightly east of normal in the West Pacific and are pushing east further than normal, decreasing the angle between the West and East. This is consistent with a mild El Nino.
(Lower Image) Notice 2 pockets of anomalously warm water pushing east. Each pocket is a weak Kelvin Wave, consistent with weak El Nino.
.
Equatorial Pacific Sea Surface Temperature Forecast
Courtesy: NOAA/NCEP
Notice that the average of many separate runs of the NCEP model suggest a continuation of warmer waters in the tropical East Pacific into Spring of 2007.
.
Southern Oscillation Index (SOI)
Courtesy: BOM
The SOI depicts the difference in pressure between Tahiti and Darwin Australia. When it is consistently negative (that is surface pressure is lower in Tahiti than Darwin Aust), the trend is then towards El Nino. And when it is positive the trend is towards La Nina. Notice the recent spikes of downward pressure in June and again August, typical of a weak El Nino.
|