Swell Classification Guidelines
Significant: Winter - Swell 8 ft @ 14 secs or greater (11+ ft faces) for 8+ hours (greater than double overhead).
Summer - Head high or better.
Advanced: Winter - Swell and period combination capable of generating faces 1.5 times overhead to double overhead (7-10 ft)
Summer - Chest to head high.
Intermediate/Utility Class: Winter - Swell and period combination generating faces at head high to 1.5 times overhead (4-7 ft).
Summer - Waist to chest high.
Impulse/Windswell: Winter - Swell and period combination generating faces up to head high (1-4 ft) or anything with a period less than 11 secs.
Summer - up to waist high swell. Also called 'Background' swell.
Surf Heights for Hawaii should be consider 'Hawaiian Scale' if period exceeds 14 secs.
BUOY ROUNDUP
On
Saturday, September 3, 2016
:
- Buoy 146 (Lanai): Seas were 3.0 ft @ 15.4 secs with swell 1.8 ft @ 14.8 secs from 267 degrees.
- Buoy 46025 (Catalina RDG): Seas were 2.5 ft @ 5.9 secs with swell 0.9 ft @ 13.7 secs from 189 degrees. Wind northwest 8-10 kts. Water temperature 71.2 degs. At Santa Barbara swell was 2.6 ft @ 6.7 secs from 261 degrees. At Santa Monica swell was 2.0 ft @ 6.3 secs from 260 degrees. Southward from Orange County to San Diego swell was 1.2 ft @ 14.7 secs from 181 degrees.
- Buoy 46012 (Half Moon Bay)/029 (Pt Reyes): Seas were 7.3 ft @ 8.3 secs with swell 5.6 ft @ 7.9 secs from 315 degrees. Wind northwest 18-21 kts. Water temp 57.7 degs.
Notes
Buoy 46059, Hi-res Buoys
PACIFIC OVERVIEW
Current Conditions
On Saturday (9/3) in North and Central CA local north windswell was producing surf at waist to maybe chest high on the peaks and lightly chopped from northwest winds. At Santa Cruz surf was flat and clean with nary a sign of south swell. In Southern California up north northwest windswell was producing surf at knee to thigh high and clean but gutless. Down south windswell was producing set waves in the waist high range and crumbled with some bump intermixed. Further down south top spots had set waves in the waist to high range and almost chopped early. Hawaii's North Shore was getting wrap around east proto-swell at 2-3 ft overhead and pretty raw from northeasterly winds. The South Shore was small with sets knee to thigh high and clean at top break but with brisk east winds in control. The East Shore was getting east windswell at 10 ft (double overhead.cgius) and chopped.
See QuikCASTs for the 5 day surf overview or read below for the detailed view.
Meteorological Overview
No swell is in the water in California on Saturday (9/3) other than local windswell. In Hawaii east swell from Lester was hitting the east Shore of most all Islands and on the increase. From the southern hemi swell is tracking northeast from a gale that developed under New Zealand on Sun-Mon (8/29) with seas to 36 ft. That system redeveloped while tracking east on Tues-Wed (8/31) still producing 30-32 ft seas aimed east-northeast. Small swell is to result. And another gale is forecast tracking under New Zealand on Wed (9/7) then lifting northeast while fading Thursday. In the North Pacific Typhoon Lionrock was previously in the far West Pacific and produced winds and seas continuously Thurs-Mon (8/29) in the 30-40 ft aimed east-northeast but isolated to the far West Pacific (just south of Japan). Some small swell to result mainly for California late in the Labor Day weekend. Hurricane Lester was tracking west-northwest from a point 130 nmiles north of the Big Island of Hawaii with winds 80 kts and expected to continue on that course with no direct interaction with the Islands expected. Otherwise no normal Fall-like swell producing weather systems are forecast in the Dateline-Aleutian corridor.
SHORT- TERM FORECAST
Current marine weather and wave analysis.cgius forecast conditions for the next 72 hours
North Pacific
Overview
Surface Analysis
On Saturday (9/3) no swell is in-flight and none is expected for the next 72 hours. Weak low pressure is over the Northern Dateline region moving into the Bering Sea with no fetch associated with it. High pressure at 1028 mbs was filling the Gulf of Alaska.
The California coastal pressure gradient on Sat (9/3) was in.cgiay but nothing remarkable driven by high pressure at 1030 mbs centered 1,500 nmiles west of Central CA ridging east and producing north winds at 20 kts down the coast of North CA and 15-20 kts down the Central CA coast generating small weak and raw local windswell. That gradient is to build some on Sun (9/4) with north winds 25 kts over North CA and 20 kts over all Central CA waters with windswell on the increase. More strengthening is forecast on Mon (9/5) with north winds 25-30 kts over North CA and 20 kt over outer Central CA waters and 15 kts nearshore. Then on Tues (9/6) the gradient is to back off some with north winds 20-25 kts over North CA and 20 kts off the Central Coast dropping to 15 kts nearshore. Windswell to build or fall commensurate with the north winds over the North Coast.
For Hawaii on Sat (9/3) all swell was being generated by Hurricane Lester. Over the next 72 hours Lester is to move out of the picture on Sun (9/4) with east trades associated with high pressure 1,100 nmiles north of the Islands continuing at 15 kts offering some windswell production. But by Mon (9/5) the high is to move east and trades are to fall below the 15 kts threshold and hold there into Tues (9/6) offering no windswell production capacity.
North Pacific Animations: Jetstream - Surface Pressure/Wind - Sea Height - Surf Height
Tropical Update
Typhoon Lionrock was 450 nmiles south of Southwestern Japan on Thurs AM (8/25) at 23.7N 131E (5,281 nmiles out on the 298.5 degree path) with winds 110 kts and starting to move east-northeast with seas 31 ft. On Fri (8/26) winds fell to 90 kts with Lionrock starting to accelerate to the east-northeast with seas down to 28 ft. But on Sat AM (8/27) strengthening had again set in with winds building to 105 kts at 24.5N 134.7E with seas 35 ft building in the evening to 110 kts with 38 ft seas at 26N 136.6E. On Sunday AM (8/28) winds were up to 115 kts with 442 ft seas at 28.5N 138.9E (4768 nmiles on the 298 degs to NCal). On Mon AM (8/29) this system was accelerating to the north-northeast 150 nmiles east of Central Japan with winds 70 kts and seas 26 ft at 32.7N 143.4E turning to the north in the evening with swell producing fetch fading out. Given it's relative strength and heading and weak forward motion Thursday through Sunday some small swell could be generated in this window. But it has a long ways to travel and the fetch area is small. Assuming swell is to result, arrival time with period 16 secs would be 8.8 days, or Sat 2 AM (9/3) continuing through Mon (9/5). Odds very low of any measurable/rideable swell to result.
NCal: Swell to become noticeable on Sun (9/4) at 2.2 ft @ 17-18 secs (3.5-4.0 ft) later. Swell continues on Mon (9/5) at 2.1 ft @ 15-16 secs (3 ft) dropping Tues (9/6) from 1.5 ft @ 14-15 secs (2.0-2.5 ft). Swell Direction: 295-298 degrees
Hurricane Lester peaked on Sat PM (8/27) with winds 95 kts positioned 1000 nmiles south of Pt Conception or 2100 nmiles east of Hawaii tracking due west. On Sun AM (8/28) winds were down to 80 kts still heading west. Lester rebuilt on Mon (8/29) peaking again in the evening with winds up to 120 kts and seas 48 ft at 18.1N 131.2W 1600 nmiles east of the Big Islands on the 90 degree track. On Tues AM (8/30) winds were down to 105 kts with seas 39 ft at 18.1N 133.8W. Lester continued on a westerly track on Thurs (9/1) 600 nmiles east of the Big Island with winds fading slowly from 90 kts and seas 35 ft at 18.3N 143.1W. On Fri AM (9/2) Lester was 450 nmiles east of the Big Island with winds 90 kts and slightly lifting to the west-northwest. Lester was on track to be 120 nmiles north of the Big Island Saturday afternoon (9/3) with winds 80 kts (still hurricane force) and starting to accelerating on that heading, positioned 200 nmiles north of Oahu on Sun AM (9/4) with winds 70 kts. This path is virtually unchanged from previous tracks and strengths. Some degree of raw swell is already hitting the North Shores of most Islands on Sat AM and is to continue into Sun (9/4), but quickly fading as the core of the storm passes west of any given point on that track.
Oahu (East Shore): Swell building on Sat (9/3) to 8 ft @ 13-14 secs late (10 ft). Swell fades out on Sun (9/4) from 4.5 ft @ 9-10 secs (4 ft). Swell Direction: 75 degrees
California Nearshore Forecast
On Saturday AM (9/3) high pressure was 1200 nmiles west of San Francisco at 1030 mbs ridging east into North CA generating 20-25 kts north winds over North CA nearshore waters and 15-20 kts for Central CA. More of the same is forecast for Sunday but with north winds building in coverage at 25 kts over North CA waters later and 20 kts over Central CA waters. More of the same is expected on Mon (9/5) with north winds 25+ kts over all of North CA and 20 kts down to Pt Conception but pulling away from the coast at only 15 kts from Monterey Bay southward and continuing on Tuesday. On Wednesday (9/7) 25+ kt north winds to hold over NCal waters but and eddy flow (south winds) is to start developing over all of Central CA waters becoming more pronounced Thurs and Friday with north winds at 25 kts limited to the Cape Mendocino area. On Saturday evening the north winds flow is to start breaking down over Cape Mendocino from 15-20 kts.
South Pacific
Overview
Jetstream
On Saturday AM (9/3) the jetstream pattern was somewhat diffuse and not well defined. The northern branch was generally tracking east over the 35S latitude line with the strongest pocket of winds over the Central South Pacific at 140 kts and unimpressive. The more important southern branch was ridging hard south under New Zealand pushing over Antarctic Ice down at 70S continuing there to the Southeast Pacific, lifting north but with no velocity for a bit before crashing back south and pushing under the southern tip of South America. There were no troughs and no support for gale development. Over the next 72 hours more of the same is forecast but with reinforcing winds pushing into Antarctica under New Zealand at 130+ kts on Sun-Mon (9/5) and sweeping east, continuing the lockdown and offering no support for gale formation. Beyond 72 hours yet another ridge is to be developing southwest of New Zealand on Wed (9/7) but with 130-140 kt south winds preceding it forming a steep trough that is to cut off on Thurs (9/8) still pushing north along the east coast of New Zealand offering some decent support for gale development. But by Friday (9/9) a weak ridging pattern is to again take hold over the entire South Pacific. But on Sat (9/10) the southern branch is to be lifting north under New Zealand to 55S with winds 90-100 kts suggesting some sort of a trough possibly developing.
Surface Analysis
On Saturday (9/3) swell is pushing northeast from a 2 part gale that tracked from New Zealand to the Central South Pacific (see New Zealand Gale Part 1 and Part 2 below).
Over the next 72 hours no swell producing fetch of interest is forecast.
New Zealand Gale (Part 1)
A gale developed under New Zealand Sun AM (8/28) producing a broad fetch of 45 kt southwest winds with seas at 32 ft at 56S 158E (in the NCal swell window at 221 degs, in the SCal swell window at 222 degs, and shadowed by NZ relative to HI). In the evening fetch is to be more consolidated but di.cgiaced south some at 45 kts with seas 33 ft at 53.5S 164E (221 degs NCal, 222 degs SCal, still shadowed by New relative to HI). On Mon AM (8/29) southwest winds were aimed more to the northeast and rebuilding some at 45 kts tracking east with seas 35 ft over a broad area at 57S 172E (212 degs NCal and unshadowed, 213 degs SCal and shadowed by Tahiti, 195 degs Hl). In the evening the gale was holding while tracking east still producing 40-45 kt winds aimed well to the northeast with seas 37 ft down at 59S 178E (206 degs NCal and in the middle of the shadow, 209 degs SCal and becoming unshadowed, 192 degs HI). On Tues AM (8/30) fetch is to be fading from 35 kts from the southwest pushing east with 31 ft seas at 59S 174W. Swell was radiating northeast towards HI and CA and expected to reach well down into Central America.
South CA: Expect swell arrival on on Tues 10 PM (9/6) with period 20 secs and size tiny and slowly building. Swell 1.3 ft @ 19 secs (2.5 ft) on Wed (9/7). Period turning to 18 secs near Wed 8 PM (9/7) pushing 1.5 ft @ 18 secs (2.5-3.0 ft). Swell peaking as period hits 17 secs at 5 AM on Thurs (9/8) at roughly 1.6 ft @ 17 secs (2.5-3.0 ft). Swell fading on Fri (9/9) from 1.5 ft @ 16 secs (2.5 ft) fading from 15 secs on Sat AM (9/10) and merging with Part 2 of the swell (below). Swell Direction: 216-222 degrees
North CA: Expect swell arrival on on Wed 2 AM (9/7) with period 20 secs and size tiny and slowly building. Period turning to 18 secs near Wed 8 PM (9/7) pushing 1.4 ft @ 18 secs (2.5 ft). Swell peaking as period hits 17 secs at 9 AM on Thurs (9/8) at roughly 1.4 ft @ 17 secs (2.5-3.0 ft). Swell fading on Fri (9/9) from 1.4 ft @ 16 secs early (2.0-2.5 ft) fading from 15 secs on Sat AM (9/10) and merging with Part 2 of the swell (below). Swell Direction: 215-221 degrees
Hawaii: Expect swell arrival on Mon (9/5) building to 1.6 ft @ 17 secs later (2.5-3.0 ft). Swell steady on Tues (9/6) at 1.6 ft @ 15-16 secs (2.5 ft). Swell fading on Wed (9/7) from 1.6 ft @ 14-15 secs early (2.0-2.5 ft). Swell Direction: 192-198 degrees
New Zealand Gale (Part 2)
Starting Tues PM (8/30) a second part to the New Zealand Gale formed. A new broad fetch of 40 kt west winds developed south of New Zealand with seas on the increase from 30 ft under New Zealand at 59S 176E. On Wed AM (8/31) a broad fetch of 40 kt southwest winds were in.cgiay generating 32 ft sea at 56S 173W (208 degs NCal and shadowed, 209 degs SCal and barely unshadowed by Tahiti, 190 degs HI and aimed well east of the paths there). In the evening 40 kt southwest winds were holding with seas 31 ft over a broad area aimed northeast at 50S 157W (202 degs NCal and unshadowed by Tahiti, 203 degs SCal and unshadowed by Tahiti, 186 degs HI). Fetch was fading in coverage from 35 kts Thurs AM (9/1) with 30 ft seas at 54S 158W, then fading.
More swell is likely for Hawaii, California and down into South America.
Hawaii: Swell arrival forecast on late Tues (9/6) to 1.3 ft @ 19 secs late (2.5 ft). Swell peaking on Wed (9/7) at 1.6 ft @ 18 secs early (2.5-3.0 ft) and up to 1.8 ft @ 17 secs late (3.0 ft) near 4 PM. Swell fading on Thurs (9/8) from 2.1 ft @ 15-16 secs (3.0 ft). Residuals on Fri (9/9) fading from 1.8 ft @ 14 secs early (2.5 ft). Swell Direction: 190 degrees
South CA: Swell arrival expected Thurs (9/8) at at 6 AM with period 20 secs and size small building to 2 ft @ 19 secs late afternoon (3.5-4.0 ft). Swell building Fri (9/9) to 2.0 ft @ 18 secs sunrise (3.5 ft). Swell Direction: 200 degrees
North CA: Swell arrival expected Thurs (9/8) at at 8 AM with period 20 secs and size small building to 1.6 ft @ 19 secs late afternoon (3.0 ft). Swell building Fri (9/9) to 2.0 ft @ 18 secs mid-day (3.5 ft). Swell Direction: 198 degrees
South Pacific Animations: Jetstream - Surface Pressure/Wind - Sea Height - Surf Height
LONG-TERM FORECAST
Marine weather and forecast conditions 3-10 days into the future
North Pacific
Beyond 72 hours a weak low pressure system is to develop in the Western Gulf of Alaska tracking east Thurs-Sat (9/10) with northwest winds building to 25 kts, but not strong enough given it's position to result in swell. A second low is to develop south of Japan on Tues (9/6) and tropical in origin lifting northeast and over the Northern Kuril Islands by Sat (9/10) possibly tracking east thereafter. But for now neither is to be an obvious swell producers. Still waiting for Fall to arrive.
For California on Wednesday (9/7) high pressure at 1032 mbs is to be moving closer to the coast from a point 1200 nmiles west of North CA generating the usual pressure gradient over North and Central CA producing north winds at 25 kts extending from Cape Mendocino south to Monterey Bay but off the coast from Pt Arena southward setting up an eddy flow nearshore but with good windswell generation potential. The north winds flow is to hold if not build in coverage on Thursday then lifting north on Friday still at 25 kts before starting to dissipate on Sat (9/10). Windswell building with decent local conditions for Central CA then fading on Saturday.
For Hawaii starting Wed (9/7) high pressure is to start ridging south some at 1032 mbs generating a broader area of patchy east winds at 15 kts extending from 1200 nmiles east of the Islands pushing over Hawaii resulting in small east windswell. This setup is to continue Thurs (9/8) but building in coverage continuously from North CA to a point 600 nmiles east of Hawaii and holding Friday. Odds for east windswell improving. The fetch and windswell are to dissipate on Sat (9/10).
South Pacific
Beyond 72 hours a storm is forecast to develop under Tasmania on Tues AM (9/6) producing 50-55 kt southwest winds and 43 ft seas aimed east-northeast but shadowed by HI and CA by New Zealand. In the evening south fetch at 55 kts is to move to 55S 165E and into the CA swell window but 39 ft seas still shadowed by New Zealand. On Wed AM (9/7) 45 kt south winds are to become exposed with seas 37 ft at 53S 169E aimed well to the north offering good swell production potential for HI and CA. Wed PM fetch is to be lifting north at 40 kts generating 35 ft seas at 49S 176E aimed well to the northeast. That fetch is to continue north Thurs AM (9/8) at 40 kts in pockets with 30-32 ft seas generally near 42S 178E. This system is to fade in the evening. Something to monitor.
More details to follow...
One Model Suggests La Nina Has Peaked
The Madden Julian Oscillation is a periodic weather cycle that tracks east along the equator circumnavigating the globe. It is characterized in it's Inactive Phase by enhanced trade winds and dry weather over the part of the equatorial Pacific it is in control of, and in it's Active Phase by slack if not an outright reversal of trade winds and enhanced precipitation. The oscillation occurs in roughly 20-30 day cycles (Inactive for 20-30 days, then Active for 20-30 days) over any single location on the.cgianet, though most noticeable in the Pacific. During the Active Phase in the Pacific the MJO tends to support the formation of stronger and longer lasting gales resulting in enhanced potential for the formation of swell producing storms. Prolonged and consecutive Active MJO Phases help support the formation of El Nino. During the Inactive Phase the jet stream tends to .cgiit resulting in high pressure and less potential for swell producing storm development. The paragraphs below analyze the state of the MJO in the Pacific and provide forecasts for MJO activity (which directly relate to the potential for swell production).
Overview: The 2014-2016 El Nino is all but gone except for remnants in the upper atmosphere. La Nina is developing but weaker than expected.
KWGA/Equatorial Surface Wind Analysis & Short-term Forecast:
Analysis (TAO Buoys): As of Thursday (9/1) east winds were over the entire equatorial Pacific and over the Kelvin Wave Generation Area (KWGA is on the equator from 135E-170W and 5 degs north and south). Anomalies were neutral over the equatorial East Pacific and the KWGA.
1 Week Forecast (GFS Model): Weak east anomalies were over the KWGA per this model suggestive of the Inactive Phase of the MJO and forecast to continue weakening slowly but still present a week out on 9/10.
Kelvin Wave Generation Area wind monitoring model: West and East
Longer Range MJO/WWB Projections:
OLR Models: As of 9/2 a neutral MJO signal was over the West Pacific. The Statistic model projects that pattern holding for the next 2 weeks. The dynamic model depicts an Inactive Phase of the MJO building modestly in the West over the next 2 weeks.
Phase Diagrams 2 week forecast (ECMF and GEFS): (9/3) The ECMF model indicates the Active Phase of the MJO was very weak and not discernible. The forecast projects no change for the next 2 weeks. The GEFS model depicts the same thing. No affect from the Active Phase of the MJO is forecast.
40 day Upper Level Model: (9/3) This model depicts a weak MJO pattern with no coherent Active or Inactive signal present. A weak Inactive Pattern is to be developing in the West Pacific starting 9/20 and easing east into the Central Pacific through 10/13 but remaining generally weak.
CFS Model - 3 month (850 mb wind): This model depicts a weak Active MJO pattern all but gone over the KWGA with no real anomalies in.cgiay. A very weak Inactive Phase is to follow 9/11-10/5 offering no real anomalies either. Then an slightly stronger Active MJO signal is to follow 10/13 -11/15 with a somewhat more defined west anomaly wind pattern setting up in the KWGA. But overall the MJO signal is very weak now and is to build only slightly as we move into Fall. La Nina is having the effect of dampening the MJO, but not biasing it towards the Inactive Phase. There no suggestion of a major pulse of east anomalies developing in the KWGA.
CFSv2 3 month forecast for 850 mb winds, MJO, Rossby etc
Subsurface Waters Temps
TAO Array: (9/2) No Change - Actual temperatures are steady in the West Pacific at 30+ degs C (reaching east to 163E) and the 28 deg isotherm line reaching east to only 172W but getting steeper, suggesting a hard break between warm water in the west and cool water in the east at depth. Warm anomalies at +1 degs rule from the West Pacific to 170W with weak negative anomalies east of there towards Ecuador (-1 degs or less). Cool subsurface waters are at depth erupting near 150W. -3 degs anomalies are no longer present at depth with peak negative temps are now only -2 degs at 140W. The Kelvin Wave pipeline is still full of modestly cool water pushing east through it. Per the hi-res GODAS animation posted 8/26 depicts a pocket of +1-2 deg anomalies building in the West Pacific to 170W. Cool water -3 degs below normal was under the the equator forming a bubble in a broad pocket at 150W and upwelling there, with a second pocket at 100W upwelling there too. La Nina is in control of the ocean at depth, but not strongly so.
Surface Water Temps: The more warm water in the equatorial East Pacific means more storm production in the North Pacific during winter months (roughly speaking). Cold water in that area has a dampening effect. Regardless of what the atmospheric models and surface winds suggest, actual water temperatures are a ground-truth indicator of what is occurring in the ocean. All data is from blended infrared and microwave sensors.
Satellite Imagery
Hi-res Nino1.2 & 3.4: (9/2) The latest images (1.2 3.4) indicates a weak cool flow developing along the coast of Peru but with weak warmer than normal water just offshore. A small pocket of cooler water is off Ecuador. Cooler waters then start building in small pockets flowing west from the Galapagos over a thin stream to 100W, but there is equal amounts of warmer water present too. The stream builds in width (8 deg N and 5 degs S) near 110W tracking solidly out to at least 160W with with peak temps -1.0 degs. La Nina is in control of surface waters, but weak, with remnant El Nino warm water holding from 105W and points east of there. Almost no warm water remains anywhere in the Nino 3.4 region, but warm water has rebuilt in the Nino 1.2 region.
Hi-res 7 day Trend (9/2): A neutral if not slightly cooler trend is over waters of Chile and Peru. A building warming stream now extends from over the Galapagos out to 115W. Intermixed pockets of warming and cooling water continue west from 120W to 160W. A major warming trend is fading some off Africa.
Hi-res Overview: (9/20) A La Nina cool pool is present in the Central equatorial Pacific from 120W to 180W. A thin cool stream that was tracking west from the Galapagos feeding that cool pool is choking off if not gone. No cool waters exist along Ecuador and Peru suggestive of westward dis
Nino1.2 Daily CDAS Index Temps: (9/3) Today's temps were trending slightly cooler at +0.535 degs.
Nino 3.4 Daily CDAS Index Temps: Today (9/3) temps were trending downwards at -0.512 degs. Temp are oscillating warm to cool and back in 2-3 week cycles. Temps bottomed out at -1.0 degs near 7/21-7/26.
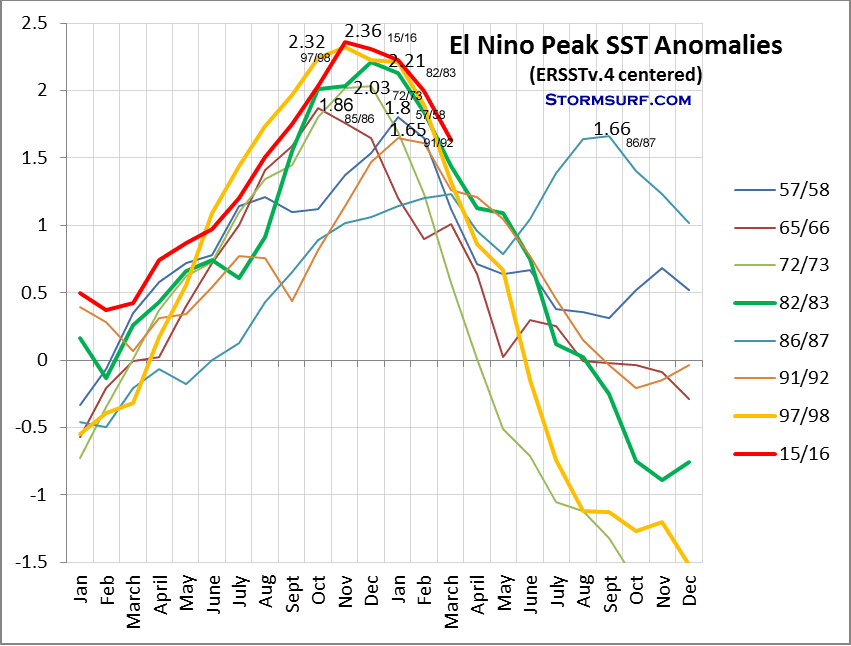 |
Comparing Stongest El Ninos in the last 50 year - ERSSTv4 'centered' data
SST Anomaly Projections
CFSv2 Uncorrected Data (9/3) This model suggests La Nina has peaked in Aug at -0.5 degs. Temps are to rise to -0.05 degs in late Oct, dipping to -0.2 degs in Dec before starting to rise to neutral in Jan 2017 and up to +0.5 by April and +0.65 by May. This is very interesting with the model continually downgrading the strength of La Nina.
IRI Consensus Plume: The mid-Aug Plume depicts temps have nearly reached their peak minimum, down at -0.5 to -0.6 by Nov and holding there to Feb, then rising. This is up again from last months peak low temp of -0.7 degs and barely in La Nina territory. See chart here - link.
Atmospheric Deco.cgiing (Indicating the presence of El Nino in the atmosphere driven by the ocean):
Southern Oscillation Index (9/3): The daily index was up some at +17.47. The 30 day average was up to at +6.00. It transitioned from negative to positive (first time in 2 years) on 5/27. The 90 day average was up some at +4.54, transitioning from negative to positive the first time in years on 7/20. El Nino is gone in all dimensions of the SOI Index now.
ESPI (like SOI but based on satellite confirmed precipitation. Positive is good, negative bad): (9/13 Today's value was rising some at -0.44. During El Nino this year it peaked on 3/12 at +1.57 then fell until 4/14, when it started rising again peaking 4/23 at +1.12. But after that La Nina took over with it falling steadily dropping as low as -1.5 in early Aug.
Pacific Decadal Oscillation: The PDO continues positive, though much weaker in July than June (as expected with La NIna setting in).
Per NOAAs index recent values (Jan-July) are: +0.79, +1.23, +1.55, +1.60, +1.43, +0.75 and +0.18.
The Washington EDU index (Jan-July) are: +1.54, +1.75, +2.40, +2.62, +2.35, +2.03 and +1.25.
The PDO turned from a 6 year negative run (2008-2013) in early 2014 and has been positive since then. Looking at the long term record, it is premature to conclude that we have in-fact turned from the negative phase (La Nina 'like') to the positive phase (El Nino 'like'), but the data suggests that could be a real possibility. We've been in the negative phase since 1998 through at least 2013 (15 years). By the time it is confirmed (4-5 years out), we will be well into it.
See imagery in the ENSO Powertool
****
External Reference Material: El Nino Southern Oscillation (ENSO), Madden Julian Oscillation (MJO), Pacific Decadal Oscillation (PDO), Southern Oscillation Index (SOI), Kelvin Wave
Add a STORMSURF Buoy Forecast to your Google Homepage. Click Here:

Then open your Google homepage, hit 'edit' button (top right near graph), and select your location
Local Interest
Stormsurf Video Surf Forecast for the week starting Sunday (8/28): https://www.youtube.com/watch?v=-mmhaXGXo_g&feature=youtu.be&hd=1
For automatic notification of forecast updates, subscribe to the Stormsurf001 YouTube channel - just click the 'Subscribe' button below the video.
Titans of Mavericks on HBO Sports with Bryant Gumbel https://www.youtube.com/watch?v=luQSYf5sKjQ
- - -
 |
Casa Noble Tequila If you are looking for an exquisite experience in fine tequila tasting, one we highly recommend, try Case Noble. Consistently rated the best tequila when compared to any other. Available at BevMo (in California). Read more here: http://www.casanoble.com/ |
Mavericks Invitational Pieces Featuring Stormsurf:
http://www.bloomberg.com/video/how-to-predict-the-best-surfing-waves-EsNiR~0xR5yXGOlOq2MqfA.html
http://www.cbsnews.com/videos/surfs-up-for-mavericks-invitational-in-calif/
Time Zone Converter By popular demand we've built and easy to use time convert that transposes GMT time to whatever time zone you are located. It's ion left hand column on every page on the site near the link to the swell calculator.
Read all the latest news and happenings on our News Page here
Surf Height-Swell Height Correlation Table
